Stress isn’t just a feeling—it’s a physiological response that shows up in measurable ways across your body.
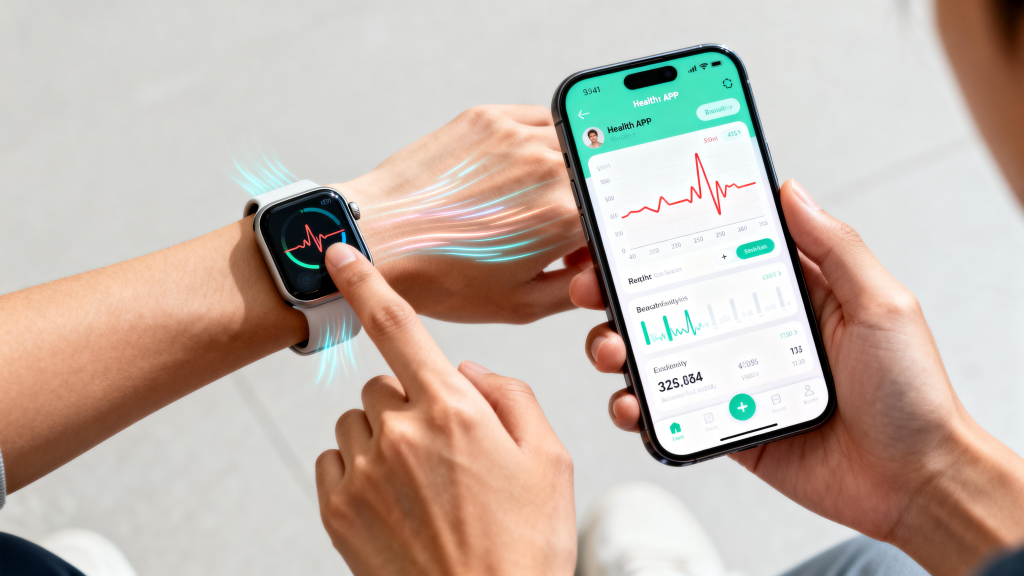
Modern smart watches turn those signals into daily stress scores or graphs, helping users spot patterns before tension turns into burnout, poor sleep, or worse. The technology doesn’t read your mind; it tracks reliable proxies for the autonomic nervous system’s “fight or flight” versus “rest and digest” balance.
The Autonomic Nervous System: The Foundation of Stress Detection
Your autonomic nervous system (ANS) runs two opposing branches:
- Sympathetic nervous system (SNS) — activates during stress, increasing heart rate, tightening blood vessels, releasing adrenaline, and raising alertness.
- Parasympathetic nervous system (PNS) — dominates during relaxation, slowing heart rate, promoting digestion, and encouraging recovery.
Chronic stress keeps the SNS dominant for too long, disrupting balance. Smart watches monitor this tug-of-war indirectly through several overlapping signals.
Primary Sensors and Signals Used
Most consumer devices rely on these key inputs to estimate stress:
- Heart Rate Variability (HRV) The tiny beat-to-beat fluctuations in your heart rate are one of the strongest indicators of ANS balance. High HRV generally means strong parasympathetic activity and good stress resilience. Low or rapidly dropping HRV signals sympathetic dominance—your body is in a prolonged “alert” state. Devices sample HRV continuously (especially overnight or during quiet periods) and use algorithms to score it on a scale, often 0–100, where lower scores indicate higher stress.
- Resting Heart Rate Trends A rising resting heart rate (especially when you’re not active) often accompanies acute or chronic stress. The watch compares your current resting rate against your personal baseline, flagging deviations as potential stress load.
- Electrodermal Activity (EDA) / Skin Conductance Some advanced models include sensors that measure tiny changes in skin sweat gland activity. Stress triggers sympathetic activation, increasing sweat even when you don’t feel hot or nervous. EDA spikes correlate with emotional arousal and acute stressors. This metric is less common but adds valuable context when available.
- Motion and Activity Context Accelerometers help distinguish true stress from normal exertion. A high heart rate while sitting quietly looks very different from the same rate during a run. Algorithms subtract exercise-related elevations to isolate psychological stress.
How Algorithms Turn Raw Data into Stress Scores
Raw signals feed into machine-learning models trained on large datasets of people under known stress conditions (lab tests, real-life diaries, cortisol measurements). The model weighs factors like:
- Recent HRV decline
- Sustained heart-rate elevation above baseline
- EDA bursts (if equipped)
- Lack of recovery during rest or sleep
The result is usually a simple score or color-coded zone (low / balanced / medium / high stress). Some devices also provide “stress resilience” trends or recovery insights, showing how well your body bounces back after stressful periods.
QONBINK integrates these principles thoughtfully by combining continuous HRV sampling with personalized baseline tracking, delivering stress insights that feel relevant rather than generic—especially useful for users who want to catch early signs of overload without constant manual logging.
Limitations and Realistic Expectations
No wrist-based system captures stress perfectly. It can’t differentiate between “good” stress (exciting presentation) and “bad” stress (deadline panic), nor can it read emotional nuance like frustration versus fear. Physical factors—caffeine, dehydration, illness, intense training—can mimic or mask stress signals. Nighttime HRV tends to be the most reliable because movement is minimal and recovery should dominate.
For the best picture, combine watch data with how you feel: Are you irritable, having trouble concentrating, sleeping poorly? If the numbers and your experience align over days or weeks, that’s when the data becomes actionable.
Practical Ways to Use Stress Monitoring
- Notice patterns — Does stress spike after certain meetings, late nights, or skipped meals?
- Build recovery habits — Short breathing exercises, walks, or early bedtimes when scores stay elevated.
- Track long-term trends — Improving HRV and lower average stress scores often follow better sleep, regular exercise, and boundary-setting at work.
Stress monitoring isn’t about eliminating stress (some is inevitable and even useful); it’s about recognizing when the load becomes unsustainable and giving yourself permission to reset.
Worn consistently, a smartwatch becomes a quiet early-warning system for the body’s stress response. The principles are straightforward—listen to your autonomic nervous system through heart rhythms, skin signals, and context—and the payoff is greater awareness and, over time, better control over how stress affects your days.
Leave a Comment
Your email address will not be published. Required fields are marked *